A/B Testing Under Uncertainty
The setup
Imagine comparing 2 models: Apollo 1.0 and Apollo 2.0. These illustrative models and the synthetically generated call data below demonstrate how I approach model evaluation.
The metric: average call duration (lower is better).
What I observe: Apollo 2.0 looks better in my sample.
Question I want to solve: Is Apollo 2.0 actually better, or did I just get a lucky sample?

Typical questions
- Which test should I use?
- One-sided or two-sided?
- What if the data are not normal?
- What if the sample size is small?
Each choice comes with its own assumptions.
In my opinion, though, the harder part is often not choosing the test itself.
It is being precise about what we are testing and explicit about the null hypothesis.
Therefore, I would rather reason through the data, keep the question in mind, and let that guide the code.
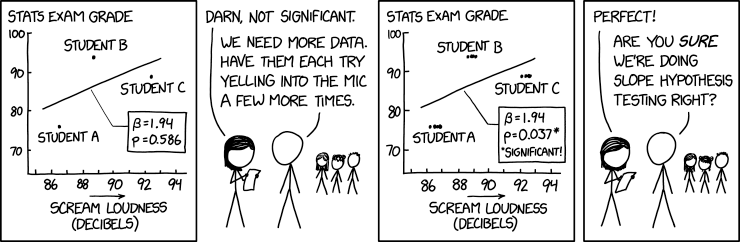
My approach
Bootstrapping is a simple yet powerful technique that is used a lot in statistical inference. It may sound fancy, but it is not.
- Idea: Simulate the distribution by drawing random samples with replacement.
- Motivation: The data estimates its own distribution, and I want to get that distribution.
- Traditional method: Use theory to study how the statistic should behave.
- Bootstrap method: Use a computer to simulate how it actually behaves.
The whole method, in a loop
import numpy as np
import pandas as pd

diffs = []

for _ in range(1000):
    a = apollo_1.sample(frac=1, replace=True)
    b = apollo_2.sample(frac=1, replace=True)
    diffs.append(b.mean() - a.mean())

lo, hi = np.percentile(diffs, [2.5, 97.5])
Try it yourself
This figure is interactive and needs JavaScript. The method it demonstrates is described in the text above.
Observed calls
The plot shows the distribution for the 2 models. You can change the number of observations below!
Try reducing the sample size.
Scroll sideways to see each full chart. With a keyboard, focus a chart and use the arrow keys.
Bootstrap uncertainty
How uncertain is the difference?
1,500 bootstrap resamples, each giving another estimate of Δ.
The result & decision
Bootstrapping gives an uncertainty around the estimated difference. It is also important to keep 3 things in mind:
-
Statistical uncertainty
How uncertain is the estimated difference? Does the 95% interval include zero?
-
Practical significance
Is it large enough for us to care about?
-
Decision risk
What could go wrong if we act on this result?
This is how I approached model evaluation in my previous roles: not simply asking which model had the better metric, but considering the uncertainty, expected impact, and risk of acting on the result. For Apollo 2.0, those factors would determine whether I develop, deploy, keep, or stop the model.
- Estimate
- Quantify uncertainty
- Weigh impact & risk
- Decide
Re-evaluate as new data arrives.
A few bootstrap caveats
- It can behave badly for non-smooth statistics. The sample maximum is the classic case.
- Very small samples can mislead, because the data may simply not represent the population well enough.
- There is no universal minimum size. How much you need depends on the data and on the statistic you are estimating.
- It does not correct selection bias or a bad sampling design.
- Standard methods assume observations are roughly independent.
Note: Bootstrapping helps quantify sampling uncertainty; it does not fix a bad sampling process.
Further reading
- Stanford Seminar: Peeking at A/B Tests, Why It Matters and What to Do About It, Ramesh Johari.
- Statistics for Hackers, Jake VanderPlas, PyCon 2016.
- There's Only One Test, Allen Downey.
- Resampling: The New Statistics, Julian Simon.